Grafana with Postgre
Sensor data visualisation with Grafana and PostGis running in Docker.
Docker
I create two containers, one for Grafana and second for database.
Grafana
  docker run -d --network=host  --name=grafana
  -e "GF_INSTALL_PLUGINS=grafana-worldmap-panel,grafana-simple-json-datasource,
  linksmart-sensorthings-datasource" grafana/grafana
- URL: http://localhost:3000/login
- username : admin
- password : admin
Grafana uses OpenStreetMap
PostGIS Database
  sudo docker run --name postgis -p 25432:5432
  -e POSTGRES_PASSWORD=postgres -d -t  mdillon/postgis
- username: postgres
- password: postgres
- grafana host: localhost:25432
- grafana database: postgres
I run two scripts:
- create tables: db_ddl.sql
- fill database: db_dml.sql
Grafana panels
Worldmap Panel
- location can be represent with longitude and latitude or with geohash.
with longitude and latitude
select time, value, latitude, longitude
from "TableName"
where $__timeFilter("time")
with geohash:
select  time, value, geohas
from "TableName"
where $__timeFilter("time")
It is important to know that fields need to be named as those in this example, otherwise you have to assign alias:
select timestamp as time,
valueField as value,
st_x(location) as latitude,
st_y(location) as longitude
from "TableName"
where $__timeFilter("timestamp")
Graph
SQL example:
select timestamp as time, value as "name"
from "tableName"
where $__timeFilter("timestamp")
in this case alias for value is used to name value that is displayed
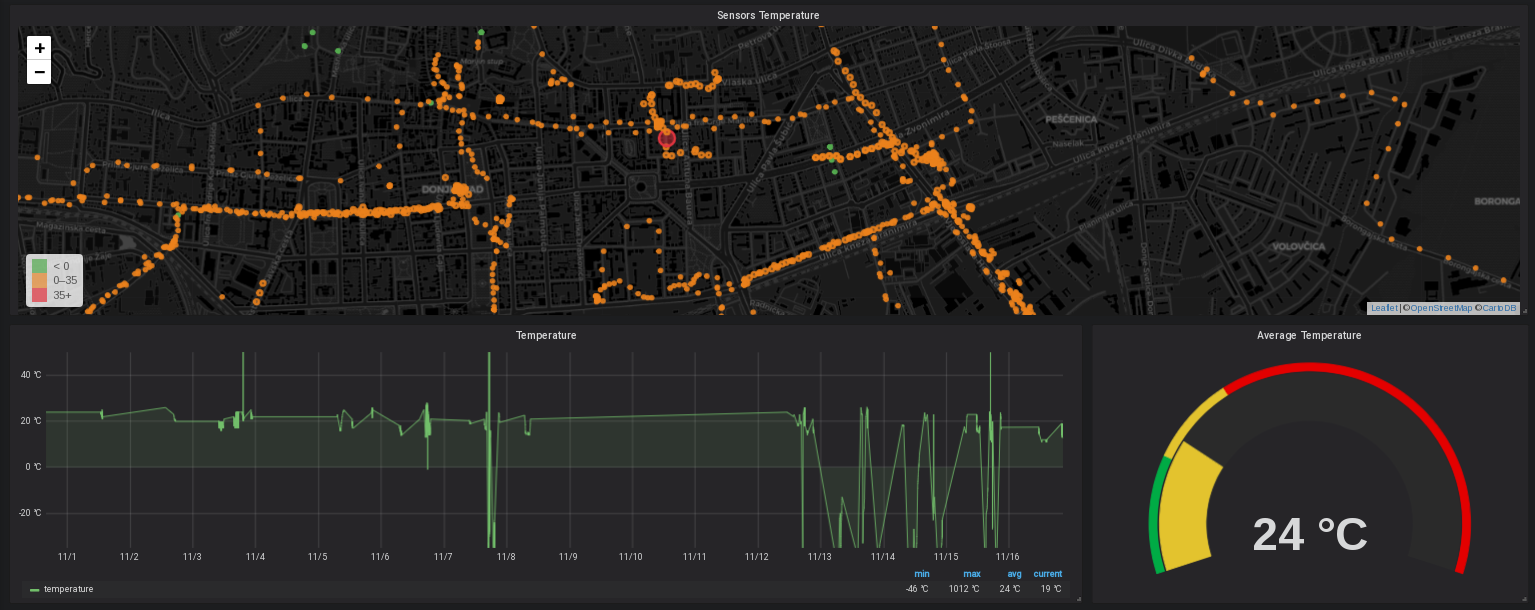
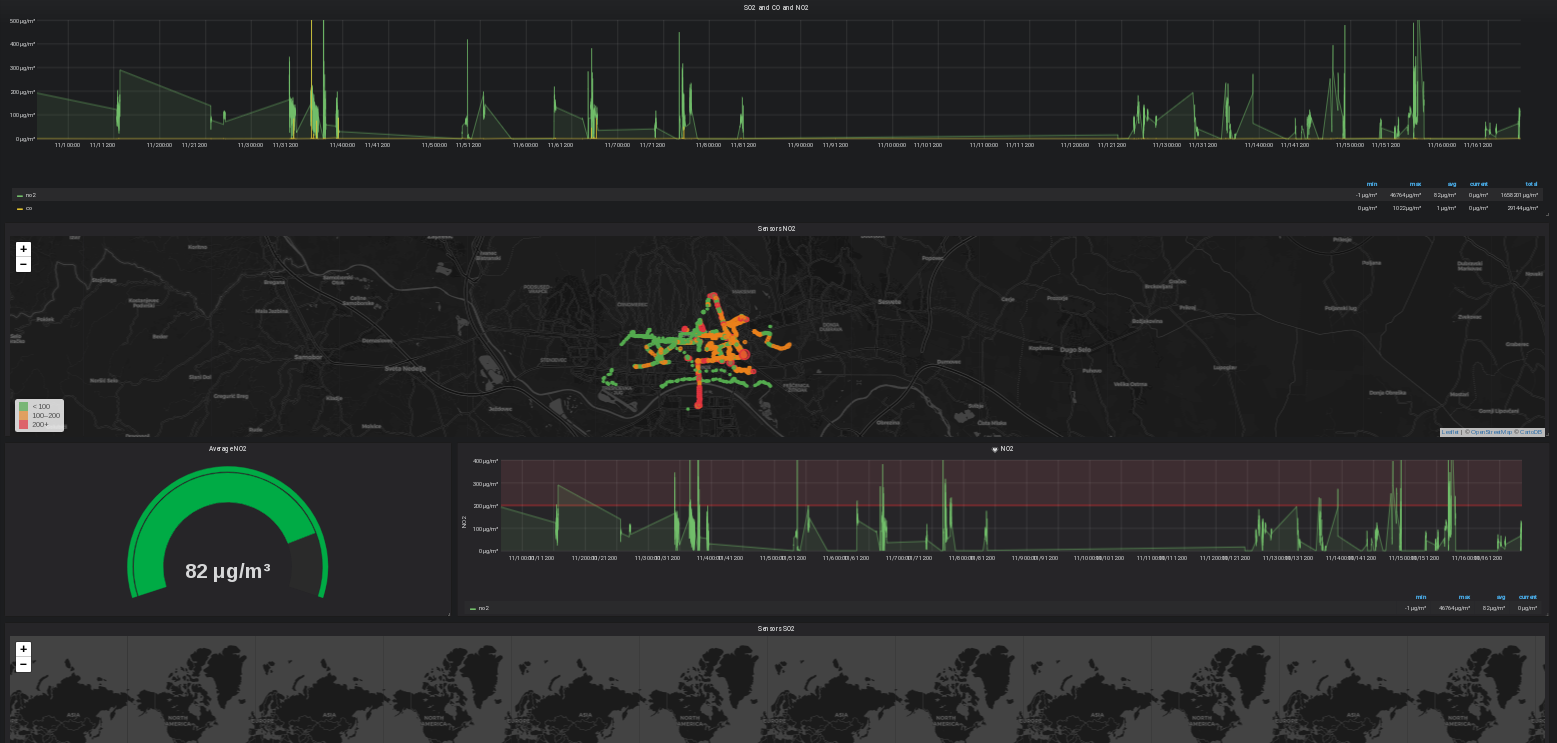
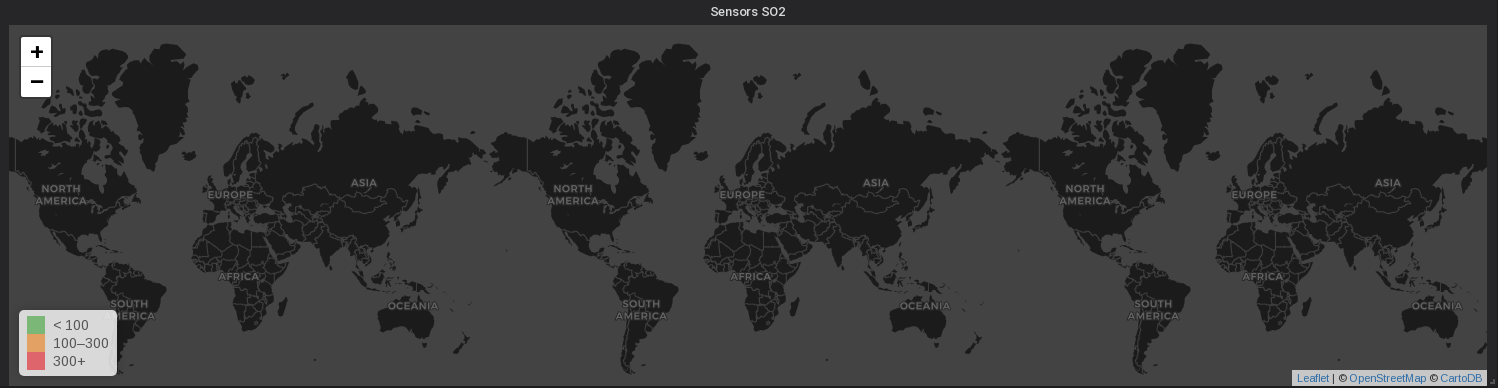
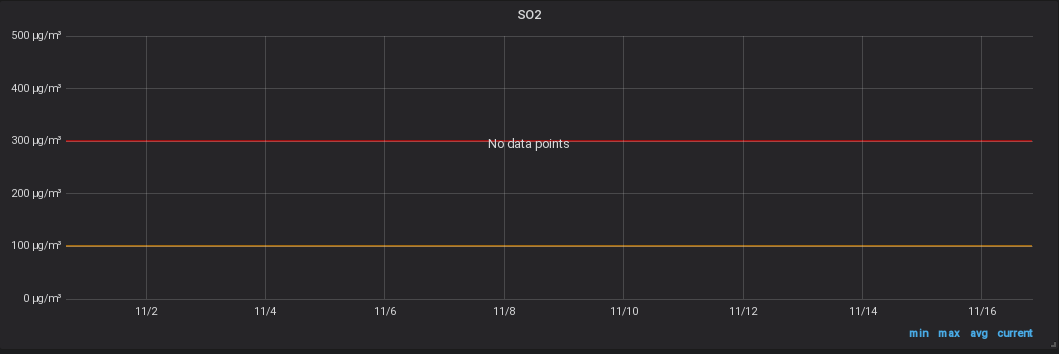
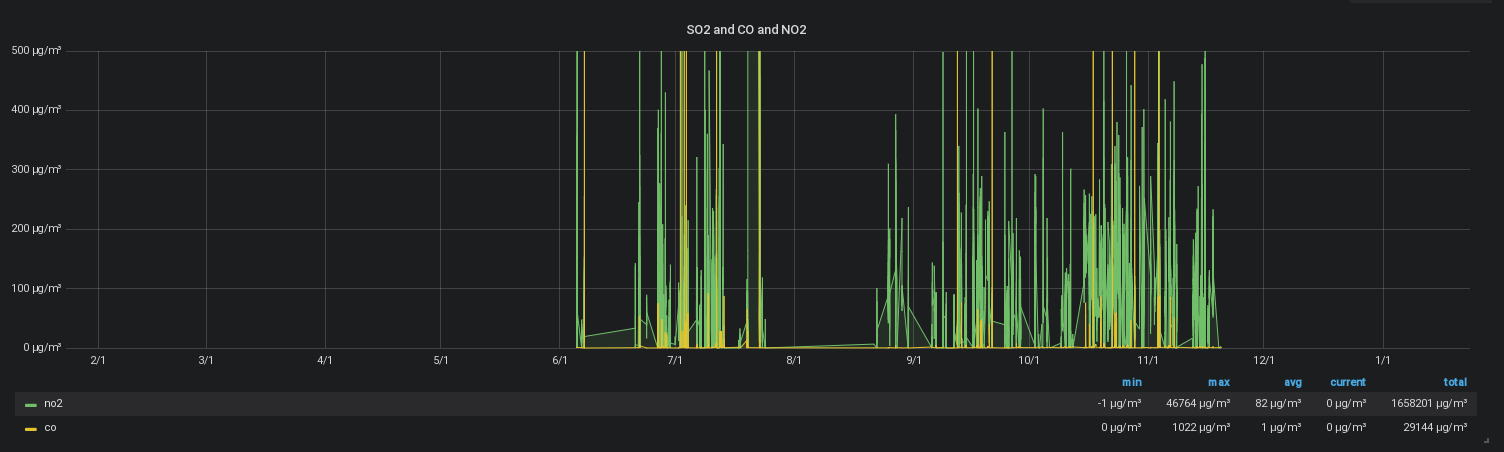
Finale result
Sensor values for SO2, CO and NO2
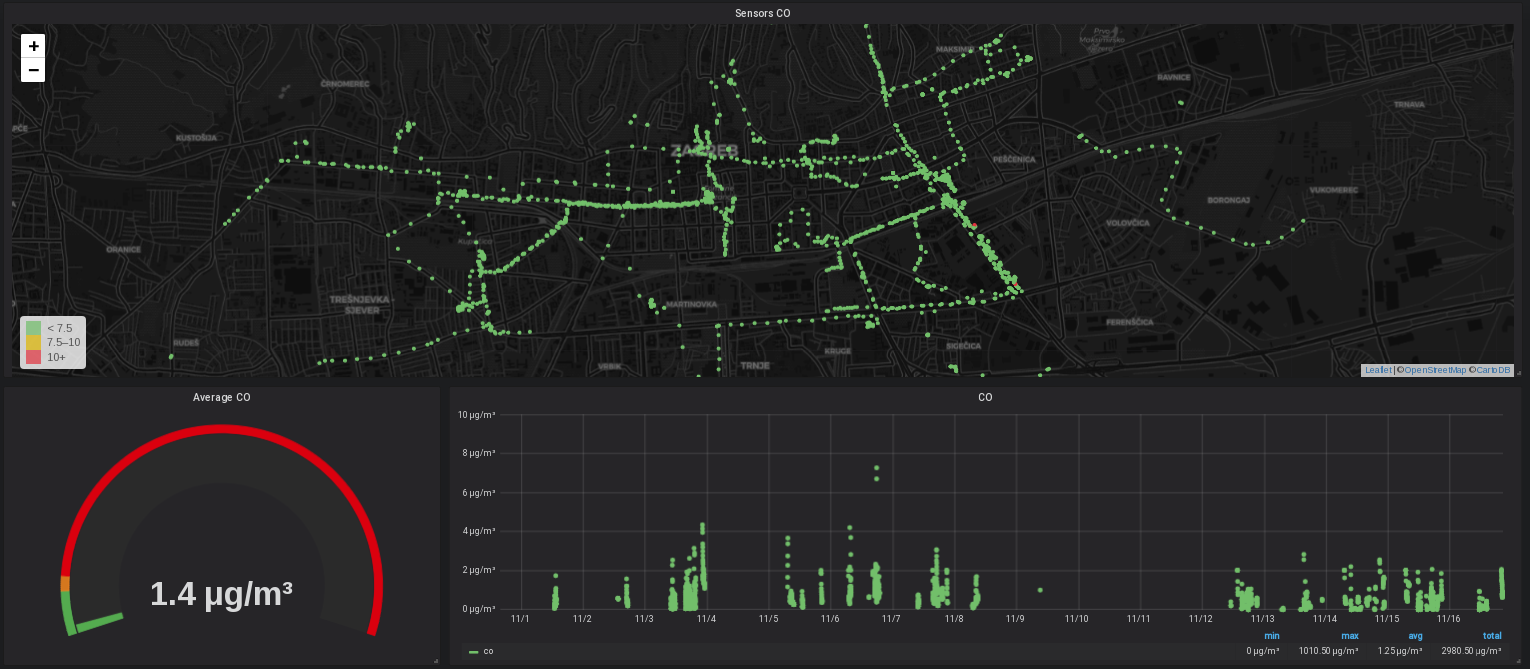
Sensor values and locations for CO
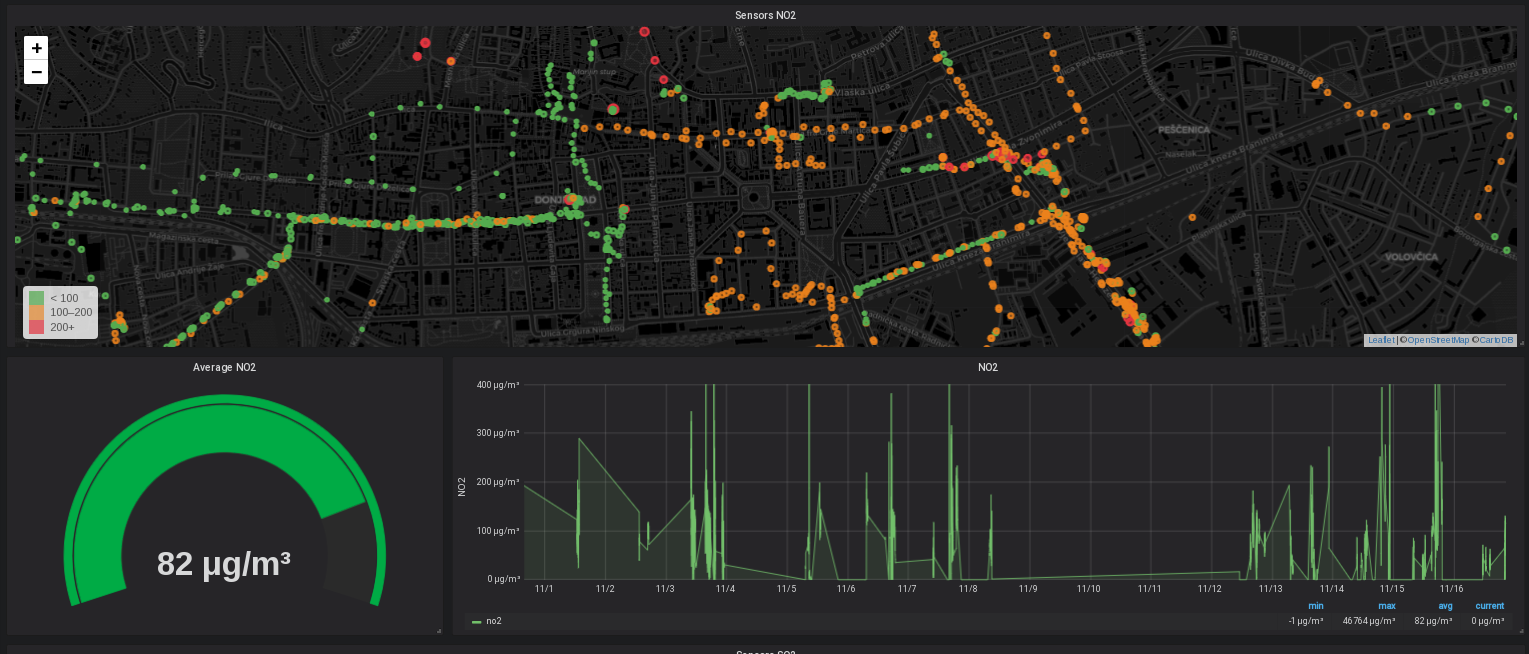
Sensor values and locations for NO
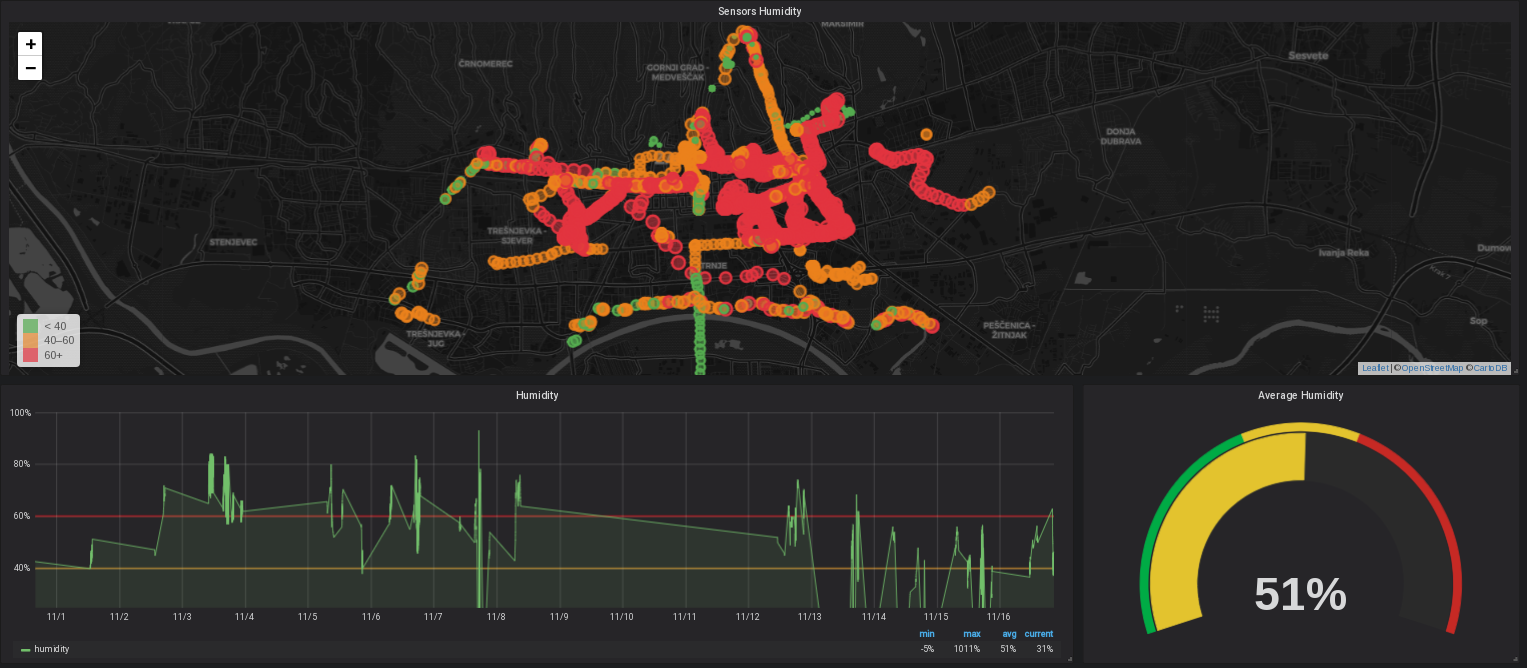
Sensor values and locations for Humidity
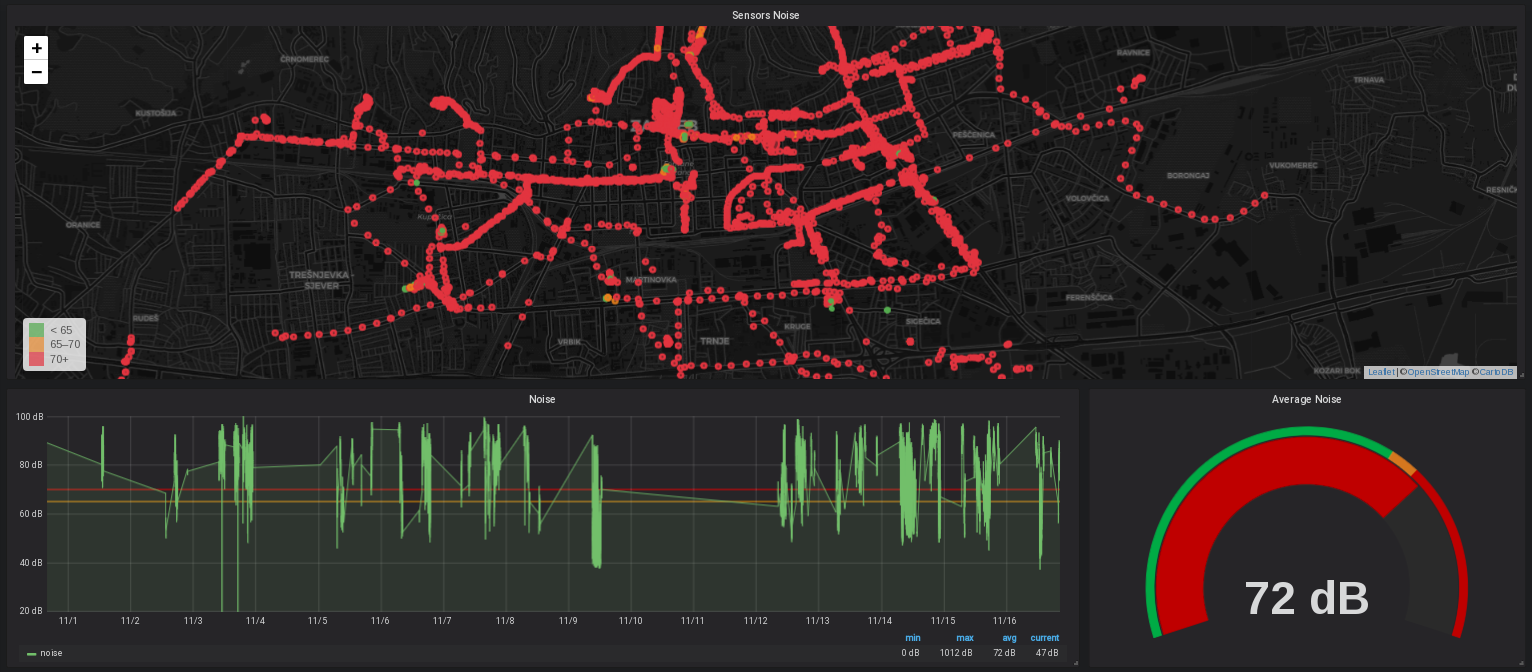
Sensor values and locations for Noise
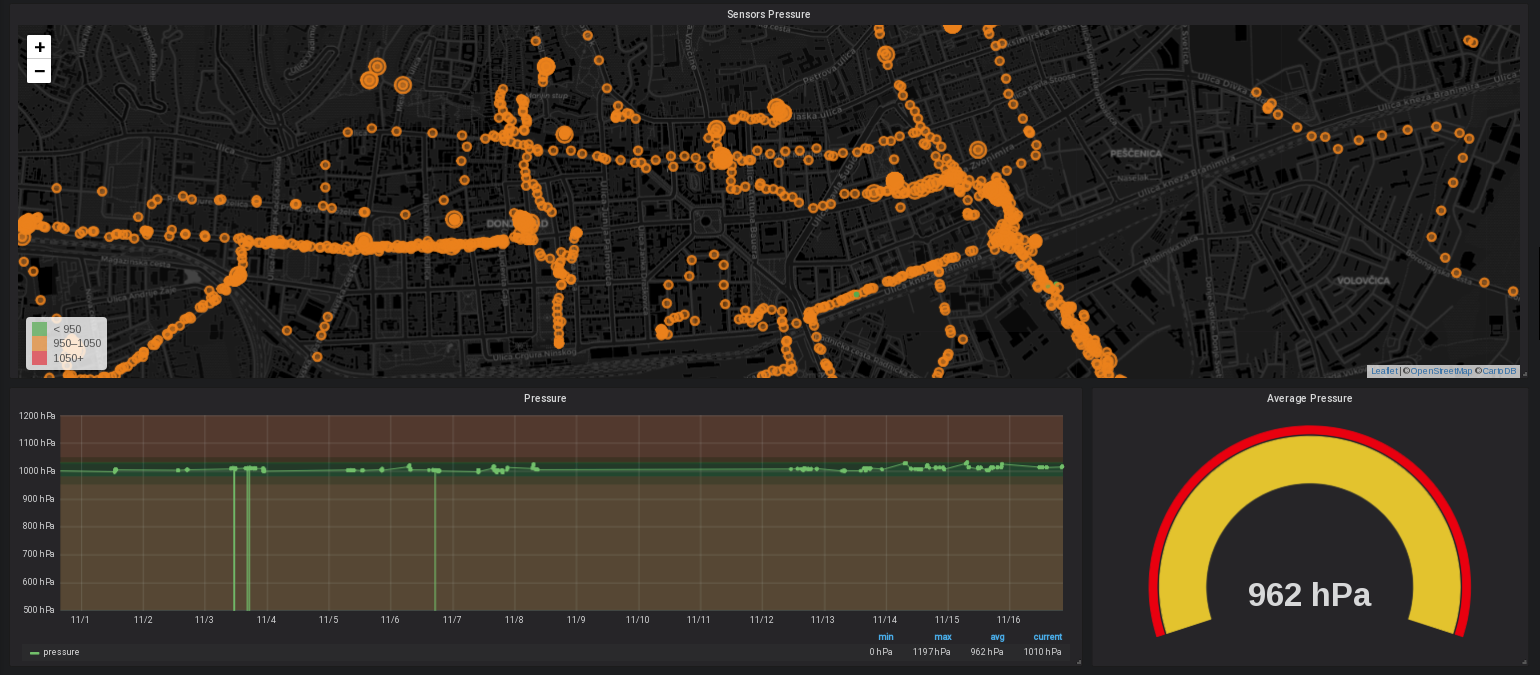
Sensor values and locations for Pressure
Sensor values and locations for Temperature